In total, only 12 of the 27 Republican state governors have outright rejected any form of participating in an ObamaCare approved Medicaid expansion. That means that 15 of the 27 either have committed to participation or remain undecided.
Specifically, accoding to research by The Advisory Board (30-year consulting company):
Fully 11 of the 27 Republican governors deciding to take ObamaCare's additional Medicaid federal funds and 4 are undecided officially at this point.
Of these 11 Republican governors who definitely will participate in the program, 8 plan to participate with the Medicaid expansion program as-is and 3 support some alternative versions of the plan specifics (which is permitted under ObamaCare if approved by CMS).
Saturday, December 21, 2013
Monday, August 26, 2013
U.S. Companies Profiting From Foreign Forced Labor Not New to Current Generation -- WARNING: Actual Photos
"There is a kind of market determinism in the air, which easily meshes with the techno-determinism of unconsidered speech, a tendency to treat the Market as the Marxists treat History—as a force overriding human choice and responsibility. There is no such thing as "business ethics," Peter Drucker has pertinently observed, only ethics."
Dangerous, even inhumane, working conditions in American factories first burst onto the national press in coverage of the Triangle WaistShirt Factory Fire (The PBS American Experience documentary video available for free viewing on this tragedy is well worth watching.) on March 25, 1911 killed 146 woman garment workers (mostly by burning or jumping out windows) locked into an unsafe factory floor in NYC.
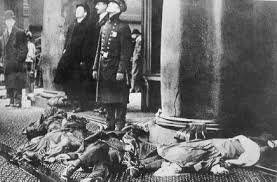
The Triangle Waistshirt Company was the biggest, most successful, most profitable women's shirt business in America ... so could have afforded better conditions.
Although the fire led to NYC workplace safety laws, some of America's biggest companies still didn't get the message. But they did start looking outwards.
Yes, that was then. But, as recently as 2001, IBM was sued for its blatant dealings with Hitler in the form of doing profitable business, such as conducting the census that Nazi Germany used to identify Jews.
UK's Daily Telegraph newspaper reported ("IBM Sued as 100 Companies Accused of Nazi Links", Tony Paterson & David Wastell, February 18, 2001) that as many as 100 American companies did business in Nazi Germany, mostly profiting from forced labor.
The New York Times story "A Fund is Planned by US Companies for Nazi Victims" published (a year earlier) on April 29, 2000 supports the Daily Telegraph report: "The fund, to be set up under the auspices of the United States Chamber of Commerce, is at least partly intended to head off class-action lawsuits against well-known American companies that had subsidiaries in Germany during the war or later purchased companies that had operations there."
Even President George W. Bush's grandfather -- and President George H.W. Bush's father -- the late U.S. Senator (and one time Wall Street financier) Prescott Bush was implicated, as a Director of a company using forced labor in Nazi Germany.

The US Holocaust Museum online resources on all types of Nazi era slave-forced labor.
As reported by UK's The Guardian newspaper "How Bush's Father Helped Hitler's Rise to Power":
"George Bush's grandfather, the late US senator Prescott Bush, was a director and shareholder of companies that profited from their involvement with the financial backers of Nazi Germany.
The following excerpt is from a classified report prepared by Pentagon attorneys for Defense Secretary Donald Rumsfeld, as reported in The Wall Street Journal in "Pentagon Report Set Framework for Use of Torture" (by Jess Bramin, June 07, 2004):
" To protect subordinates should they be charged with torture, the memo advised that Mr. Bush issue a "presidential directive or other writing" that could serve as evidence, since authority to set aside the laws is "inherent in the president."
CLICK for a partial list of companies in Germany using Nazi concentration camp and prisoner of war camp forced labor.
The Nuremberg Defense is defined as: "Many of those defendants claimed that they were not guilty of the charges against them as they were "only following orders."

Reports had been leaking out since the 1990's about dangerous, callous and un-American workplace conditions in China, Bangladesh, and other outsourcing havens. But they didn't seize the attention of American public until the 2011 exposes by several media sources on Foxconn where Apple outsourced iPhone and iPad production.
Wired Magazine published this story "1 Million Workers. 90 Million iPads. 17 Suicides. Who's to Blame?" (by Joel Johnson, February 28, 2011):
"The nets went up in May, after the 11th jumper in less than a year died here. And they seem to have worked. Since they were installed, the suicide rate has slowed to a trickle.
 The Guardian (UK) newspaper published "Mass Suicide Protest at Apple Manufacturer Foxconn's Factory" by Malcolm Moore on January 11, 2012 in which he quoted one employee protest leader:
"We were put to work without any training, and paid piecemeal," said one of the protesting workers, who asked not to be named. "The assembly line ran very fast and after just one morning we all had blisters and the skin on our hand was black. The factory was also really choked with dust and no one could bear it," he said.
The New York Times published "In China, Human Costs Are Built Into an iPad" by Charles Duhigg & David Barboza on January 25, 2012 in which they cited some of the working conditions:


by Jack Beatty, "Hitler's Willing Business Partners",
The Atlantic Magazine, April 4, 2001
Starting 100 Years Ago
Dangerous, even inhumane, working conditions in American factories first burst onto the national press in coverage of the Triangle WaistShirt Factory Fire (The PBS American Experience documentary video available for free viewing on this tragedy is well worth watching.) on March 25, 1911 killed 146 woman garment workers (mostly by burning or jumping out windows) locked into an unsafe factory floor in NYC.
The Triangle Waistshirt Company was the biggest, most successful, most profitable women's shirt business in America ... so could have afforded better conditions.
Although the fire led to NYC workplace safety laws, some of America's biggest companies still didn't get the message. But they did start looking outwards.
"NOBODY MADE A GREATER MISTAKE THAN HE WHO DID NOTHING BECAUSE HE COULD ONLY DO A LITTLE"
Yes, that was then. But, as recently as 2001, IBM was sued for its blatant dealings with Hitler in the form of doing profitable business, such as conducting the census that Nazi Germany used to identify Jews.
UK's Daily Telegraph newspaper reported ("IBM Sued as 100 Companies Accused of Nazi Links", Tony Paterson & David Wastell, February 18, 2001) that as many as 100 American companies did business in Nazi Germany, mostly profiting from forced labor.
The New York Times story "A Fund is Planned by US Companies for Nazi Victims" published (a year earlier) on April 29, 2000 supports the Daily Telegraph report: "The fund, to be set up under the auspices of the United States Chamber of Commerce, is at least partly intended to head off class-action lawsuits against well-known American companies that had subsidiaries in Germany during the war or later purchased companies that had operations there."
THE BUSH FAMILY and NAZI SLAVE LABOR
Even President George W. Bush's grandfather -- and President George H.W. Bush's father -- the late U.S. Senator (and one time Wall Street financier) Prescott Bush was implicated, as a Director of a company using forced labor in Nazi Germany.
The US Holocaust Museum online resources on all types of Nazi era slave-forced labor.
As reported by UK's The Guardian newspaper "How Bush's Father Helped Hitler's Rise to Power":
"George Bush's grandfather, the late US senator Prescott Bush, was a director and shareholder of companies that profited from their involvement with the financial backers of Nazi Germany.
"The Guardian has obtained confirmation from newly discovered files in the US National Archives that a firm of which Prescott Bush was a director was involved with the financial architects of Nazism.
"His business dealings, which continued until his company's assets were seized in 1942 under the Trading with the Enemy Act, has led more than 60 years later to a civil action for damages being brought in Germany against the Bush family by two former slave labourers at Auschwitz and to a hum of pre-election controversy.
"The evidence has also prompted one former US Nazi war crimes prosecutor to argue that the late senator's action should have been grounds for prosecution for giving aid and comfort to the enemy."
Perhaps, The Guardian chose to publish that expose in connection to George W. Bush's support for using the Nuremberg Defense to protect U.S. interrogators of suspected terrorists. The following excerpt is from a classified report prepared by Pentagon attorneys for Defense Secretary Donald Rumsfeld, as reported in The Wall Street Journal in "Pentagon Report Set Framework for Use of Torture" (by Jess Bramin, June 07, 2004):
" To protect subordinates should they be charged with torture, the memo advised that Mr. Bush issue a "presidential directive or other writing" that could serve as evidence, since authority to set aside the laws is "inherent in the president."
CLICK for a partial list of companies in Germany using Nazi concentration camp and prisoner of war camp forced labor.
The Nuremberg Defense is defined as: "Many of those defendants claimed that they were not guilty of the charges against them as they were "only following orders."
IN THE PRESENT.
Reports had been leaking out since the 1990's about dangerous, callous and un-American workplace conditions in China, Bangladesh, and other outsourcing havens. But they didn't seize the attention of American public until the 2011 exposes by several media sources on Foxconn where Apple outsourced iPhone and iPad production.
Wired Magazine published this story "1 Million Workers. 90 Million iPads. 17 Suicides. Who's to Blame?" (by Joel Johnson, February 28, 2011):
"The nets went up in May, after the 11th jumper in less than a year died here. And they seem to have worked. Since they were installed, the suicide rate has slowed to a trickle.
"Foxconn, the single largest private employer in mainland China, manufactures many of the products—motherboards, camera components, MP3 players—that make up the world’s $150 billion consumer-electronics industry. Foxconn’s output accounts for nearly 40 percent of that revenue. Altogether, the company employs about a million people, nearly half of whom work at the 20-year-old Shenzhen plant. But until two summers ago, most Americans had never heard of Foxconn.
"That all changed with the suicides. ... Some saw the Foxconn suicides as a damning consequence of our global hunger for low-cost electronics. Reports from inside the factories warned of “sweatshop” conditions; old allegations of forced overtime burbled back to life. Foxconn and its partners—notably Apple—found themselves defending factory conditions while struggling to explain the deaths. “Suicides in China Prompt Damage Control,” blared The New York Times."
"We were put to work without any training, and paid piecemeal," said one of the protesting workers, who asked not to be named. "The assembly line ran very fast and after just one morning we all had blisters and the skin on our hand was black. The factory was also really choked with dust and no one could bear it," he said.
The New York Times published "In China, Human Costs Are Built Into an iPad" by Charles Duhigg & David Barboza on January 25, 2012 in which they cited some of the working conditions:
"Employees work excessive overtime, in some cases seven days a week, and live in crowded dorms. Some say they stand so long that their legs swell until they can hardly walk. Under-age workers have helped build Apple’s products, and the company’s suppliers have improperly disposed of hazardous waste and falsified records, according to company reports and advocacy groups that, within China, are often considered reliable, independent monitors.
"More troubling, the groups say, is some suppliers’ disregard for workers’ health. Two years ago, 137 workers at an Apple supplier in eastern China were injured after they were ordered to use a poisonous chemical to cleaniPhone screens. Within seven months last year, two explosions at iPad factories, including in Chengdu, killed four people and injured 77. Before those blasts, Apple had been alerted to hazardous conditions inside the Chengdu plant, according to a Chinese group that published that warning."
The Daily Mail newspaper (UK) published "Real Toy Story: Chinese Factory Workers Forced to Sleep Among Piles of Doll Parts as They Churn Out Christmas Presents"
in which they point out: "A report in 2009 revealed that 1 million Chinese factory workers suffered industrial accidents in that year alone (among 3.5 million workers in 8,000 toy factories)" And ... "Mostly female workers, aged 18-25, work from 7:45 AM to 10:55 PM, sometimes with as many as 1,000 workers crammed into one 105-foot by 105-foot room."
The New York Times reported "Report on Deadly Factory Collapse in Bangladesh Finds Widespread Blame" (by Jim Yardley, May 22, 2013) about 1,127 garment workers killed and building owner and tenant factories' owners indicted:
"The factory owners urged workers to return to their jobs despite evidence that the building was unsafe, the report said. “They compelled them to start,” said Main Uddin Khandaker, a high-ranking official in Bangladesh’s Home Ministry, who led the investigation."
Then, on June 5, 2013, The Guardian Newspaper (UK) published "Bangladesh Police Open Fire on Collapsed Factory Protest" reporting about a peaceful demonstration by former employees and families of the killed with the demand for the government and their employers to make good on promises of care and back-pay.
COMPLETING THE 100-YEAR CIRCLE
Finally, on July 15, 2013, Reuters could report that the Bangladesh government passed labor laws that ensure the right to form labor unions, and:
"The legislation puts in place provisions including a central fund to improve living standards of workers, a requirement for 5 percent of annual profits to be deposited in employee welfare funds and an assurance that union members will not be transferred to another factory of the same owner after labor unrest."
So nothing has changed, except where American companies locate the factories. And we let them do it. "Out of site, out of mind."
102 years after the Triangle Waistshirt Factory Fire (in 1911), the same horrendous working conditions in Bangladesh and China garment, toy, and electronics factories are suddenly ... but at least ... being recognized with high-profile press coverage.
"The only thing necessary for the triumph of evil is for good men to do nothing."
Why did I write this post and write it this way ... long, photos, and in red ...?
I wrote it long and with startling photos so that you look in the mirror.
Every time we buy one of the products made by forced labor like this, feel the guilt and shame ... because the company executives won't and because your actions are the only way things will get better for these people.
Think about your grandparents, great-grandparents and other relatives who worked in the sweatshops and workhouses 6-7 days per week, 15+ hours per day. This is what you are supporting every time you buy those products ... and remain silent.
I wrote this post in red (rather than my usual teal) to reflect the blood shed for those who likely made this computer and the blood money profits earned from it.
Stand up. Speak up.
by Steve Reichenstein
Friday, August 16, 2013
Why ObamaCare Makes Sense: Some Different Facts About the Affordable Care Act
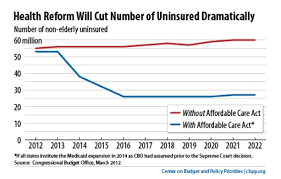
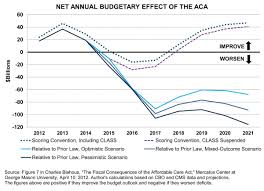
I support ObamaCare -- the Affordable Care Act -- because it reduces health care spending without reducing actual patient care and it provides health insurance coverage to include more than 30-million more Americans so that we near universal health insurance coverage.
My support for ObamaCare is not ideological, it's practical. "This is not personal; it's business." And, healthcare reform clearly is an urgent priority.
We all agree that the United States spends the largest share of the largest economy in the world on healthcare ... even more than other members of the Organization of Economic Cooperation and Development, a group of developed industrialized nations of which U.S. is a member. More than 10% of American citizens and permanent residents are uninsured.


(Above graphs compare U.S. healthcare spending versus the complete Organization for Economic Cooperation and Development ... of which the U.S. is a member)
Uncompensated Care: Health care for the uninsured and under-insured.
Currently, we pay for the health care of the non-insured and under-insured in our own higher health insurance premiums due to charity care at hospital emergency rooms and lost economic productivity.
In it's healthcare reporting, JustFacts.com : Uncompensated care spending amounted to 6% of hospitals' 2009 total costs. The U.S. Federal Reserve Bank estimated that, in a 2003 bulletin "Overview of Consumer Data and Credit Reporting", that 52% of all collections by agencies and creditors was for healthcare bills.
The 2008 Kaiser Family Foundation (www.kff.org) study "Covering the Uninsured: Key Facts" estimates spending on the uninsured was $57.4-billion -- of which $42.9-billion (or 75%) was paid by federal and state funds, mainly through Medicaid payments to hospitals, and that $14.5-billion (or 25%) was paid by private funds, mainly physicians and hospitals, and that this $14.5-billion represented nearly 2% of the $829.9-billion spent by insurance plans.
McKinsey & Company, a major consulting firm as published several research articles on the health care trends and technologies -- here now and emergent -- that support the premises of the Affordable Care Act on continual, significant cost savings through productivity and outcome savings.
Industry association America's Health Insurance Plans (AHIP) reports that "A 2009 study by Families USA (a health care consumer group) found that uncompensated care costs in 2008 imposed a "hidden tax" on family health coverage of $1,017 (per family)."
The 2009 study goes on to say: "As more people join the ranks of the uninsured, the hidden health tax is growing,' said Ron Pollack, Executive Director of Families USA. “That tax hits America’s businesses and insured families hard in the pocketbook, and they therefore have a clear financial stake in expanding health coverage as part of health reform.”
Together, the point might be made that we already pay for uncompensated care -- health care for the uninsured -- through higher taxes and insurance premiums. Also, the current spending on health care for the uninsured is not cost-effective (inefficient) because it's so heavily weighted on hospital use for primary care and late-stage care for undetected & untreated care.
ObamaCare is not a government take-over of our health care system.
The Affordable Care Act actually is a boon to private insurance companies -- in terms of the numbers of paying insureds and in terms of more efficient application of the basic premise of insurance: Based on the statistical Law of Large Numbers, many people pay premiums so that those among them who happen to need expensive treatment will be able to afford it.
The Basic Premise of Insurance in Health Insurance.
During the Great Depression of the 1930's, physicians and hospitals suffered, as did American families, because most people could not afford to pay out-of-pocket for sick care treatments ... because of the depression. So, Blue Cross and Blue Shield were born: Originally, one for physician insurance and the other for hospital insurance.
However, a comprehensive insurance system like the Affordable Care Act has to work fully in order to work efficiently ... as soon as possible.
I question why the Obama Administration continually issues waivers and delays implementation of the Affordable Care Act. And this is the central issue of this post.
Comparison of Implementation Time for ObamaCare vs. Y2K
Compare the ObamaCare situation to the challenge presented by Y2K -- just 15 years ago. every company had to change the dates part of every software from a 2-digit year to a 4-digit year by the year 2000 because, during the 1960's and 1970's, in order to be minimize development costs, software was programmed to accept the last 2 digits of the year and start again at 1900 ("00") after 1999 ("99"). Government feared nuclear launch glitches and companies feared erasing of all their records since 1900!!
Updating for Y2K became a high-profile only 2 years prior to the big day!! The big software investments and rush to prepare for Y2K began in earnest in 1998.

Changing the software for nearly every computer in America (perhaps the world) was achieved in just 2 years!!!!!!!!!!!!!
Health insurers and employers have had 3-4 years to prepare software and decisions for implementation the Affordable Care Act ... Obamacare ... yet all businesses, worldwide, had 2 years to prepare software for Y2K. Even the governments, like our Defense Department, raised the Y2K issue in 1998 and their 1999 budget requests.

The Y2K "bug" was a huge issue and challenge!! It dominated the news from 1998-2000. Jobs and spending to repair-prepare legacy systems directly boosted the economy. For example, even supermarkets, like Whole Foods, spent a fortune on it.
So why has 3+ years for health insurers and employers not been enough time for simple, available software programs to be implemented for Affordable Care Act ... Obamacare ... ??

Think about it. Personal health records and physician-hospital-insurer-employer electronic medical records (EMS software) have been around ... and booming businesses for several years!!!

Healthcare providers have been living with the federal mandate to implement electronic medical records.
Since 2011, the federal government also has imposed penalties as of 2014 but also immediately offered financial incentives ... up to $44,000 for a family medical practice ... to help the millions of physician practices afford to implement "significant use" of electronic medical records EMR.
So what's the real problem?

My opinion
Rescind all of the waivers. The Affordable Care Act ... Obamacare ... should continue to implement as enacted.
by Steve Reichenstein
My support for ObamaCare is not ideological, it's practical. "This is not personal; it's business." And, healthcare reform clearly is an urgent priority.
We all agree that the United States spends the largest share of the largest economy in the world on healthcare ... even more than other members of the Organization of Economic Cooperation and Development, a group of developed industrialized nations of which U.S. is a member. More than 10% of American citizens and permanent residents are uninsured.
(Above graphs compare U.S. healthcare spending versus the complete Organization for Economic Cooperation and Development ... of which the U.S. is a member)
Uncompensated Care: Health care for the uninsured and under-insured.
Currently, we pay for the health care of the non-insured and under-insured in our own higher health insurance premiums due to charity care at hospital emergency rooms and lost economic productivity.
The 2008 Kaiser Family Foundation (www.kff.org) study "Covering the Uninsured: Key Facts" estimates spending on the uninsured was $57.4-billion -- of which $42.9-billion (or 75%) was paid by federal and state funds, mainly through Medicaid payments to hospitals, and that $14.5-billion (or 25%) was paid by private funds, mainly physicians and hospitals, and that this $14.5-billion represented nearly 2% of the $829.9-billion spent by insurance plans.
McKinsey & Company, a major consulting firm as published several research articles on the health care trends and technologies -- here now and emergent -- that support the premises of the Affordable Care Act on continual, significant cost savings through productivity and outcome savings.
Industry association America's Health Insurance Plans (AHIP) reports that "A 2009 study by Families USA (a health care consumer group) found that uncompensated care costs in 2008 imposed a "hidden tax" on family health coverage of $1,017 (per family)."
The 2009 study goes on to say: "As more people join the ranks of the uninsured, the hidden health tax is growing,' said Ron Pollack, Executive Director of Families USA. “That tax hits America’s businesses and insured families hard in the pocketbook, and they therefore have a clear financial stake in expanding health coverage as part of health reform.”
Together, the point might be made that we already pay for uncompensated care -- health care for the uninsured -- through higher taxes and insurance premiums. Also, the current spending on health care for the uninsured is not cost-effective (inefficient) because it's so heavily weighted on hospital use for primary care and late-stage care for undetected & untreated care.
ObamaCare is not a government take-over of our health care system.
The Affordable Care Act actually is a boon to private insurance companies -- in terms of the numbers of paying insureds and in terms of more efficient application of the basic premise of insurance: Based on the statistical Law of Large Numbers, many people pay premiums so that those among them who happen to need expensive treatment will be able to afford it.
The Basic Premise of Insurance in Health Insurance.
During the Great Depression of the 1930's, physicians and hospitals suffered, as did American families, because most people could not afford to pay out-of-pocket for sick care treatments ... because of the depression. So, Blue Cross and Blue Shield were born: Originally, one for physician insurance and the other for hospital insurance.
However, a comprehensive insurance system like the Affordable Care Act has to work fully in order to work efficiently ... as soon as possible.
I question why the Obama Administration continually issues waivers and delays implementation of the Affordable Care Act. And this is the central issue of this post.
Comparison of Implementation Time for ObamaCare vs. Y2K
Compare the ObamaCare situation to the challenge presented by Y2K -- just 15 years ago. every company had to change the dates part of every software from a 2-digit year to a 4-digit year by the year 2000 because, during the 1960's and 1970's, in order to be minimize development costs, software was programmed to accept the last 2 digits of the year and start again at 1900 ("00") after 1999 ("99"). Government feared nuclear launch glitches and companies feared erasing of all their records since 1900!!
Updating for Y2K became a high-profile only 2 years prior to the big day!! The big software investments and rush to prepare for Y2K began in earnest in 1998.
Changing the software for nearly every computer in America (perhaps the world) was achieved in just 2 years!!!!!!!!!!!!!
Health insurers and employers have had 3-4 years to prepare software and decisions for implementation the Affordable Care Act ... Obamacare ... yet all businesses, worldwide, had 2 years to prepare software for Y2K. Even the governments, like our Defense Department, raised the Y2K issue in 1998 and their 1999 budget requests.
The Y2K "bug" was a huge issue and challenge!! It dominated the news from 1998-2000. Jobs and spending to repair-prepare legacy systems directly boosted the economy. For example, even supermarkets, like Whole Foods, spent a fortune on it.
Think about it. Personal health records and physician-hospital-insurer-employer electronic medical records (EMS software) have been around ... and booming businesses for several years!!!
Healthcare providers have been living with the federal mandate to implement electronic medical records.
Since 2011, the federal government also has imposed penalties as of 2014 but also immediately offered financial incentives ... up to $44,000 for a family medical practice ... to help the millions of physician practices afford to implement "significant use" of electronic medical records EMR.
So what's the real problem?
My opinion
Rescind all of the waivers. The Affordable Care Act ... Obamacare ... should continue to implement as enacted.
by Steve Reichenstein
Thursday, August 15, 2013
Not sure about Latino-Hispanic immigration reform? Read these statistics.
The United States Hispanic population is the fastest growing group, fastest growing first-time home buyers, and fastest growing in education and income attainment, according to a National Association of Hispanic Real Estate Professionals's study.
In 2009, even at the depths of the Great Recession, according to the U.S. Census Bureau, 40% of American Hispanic families and 58% All American families earned more than $50,000 annually.
"As recently as 2000, fewer than half of Latinos enrolled in college within months of finishing high school. But in 2012, the figure was 69 percent, compared with 84 percent for Asians, 67 percent for whites and 63 percent for blacks." (New York Times, May 9, 2013)
By 2012, Latino high school graduates were more likely than their white peers to believe that a college education is essential to getting ahead in life, according to a Pew Research Center survey. And, Latino high school graduates are more likely to go to college than their white peers. Overall, Latinos have made bigger gains than other groups in high school completion and college attendance.

Also according to Pew Research Center studies, as of 2009, 88% of Hispanics aged 16 and older believed that a college education is necessary to get ahead in life versus 74% of all Americans aged 16 and older.
American Hispanics are an upwardly mobile ethnic group by all measures.
Sunday, August 11, 2013
What is a Congressman / Congresswoman?
The U.S. Congress includes both the Senate and House of Representatives. So both Senators and Representatives are Congressmen.
So why do to Representatives and the
media refer to Representatives as “Congressmen”? What’s the problem with the
title “Representative”? Not important-sounding enough?
My Representative, my Member of the House of Representatives, Rodney Frelinghuysen, even signs his correspondence to constituents:
Sincerely,
Rodney P. Frelinghuysen
Member of Congress
I don't know whether this bothers me more or the fact that he begins his robo-responses:
My Representative, my Member of the House of Representatives, Rodney Frelinghuysen, even signs his correspondence to constituents:
Sincerely,
Rodney P. Frelinghuysen
Member of Congress
I don't know whether this bothers me more or the fact that he begins his robo-responses:
What's your opinion: Member of the House of Representatives, Member of Congress, or Your House Representative?
By Steve Reichenstein
By Steve Reichenstein
Sunday, August 4, 2013
Drug Laws: Prisons, Health, and Economics
The United States joined other nations in calling the War on Drugs a Failure and signing a 2011 Global Commission on Drugs Report with recommendations that include decriminalization of drug possession, regulated distribution of marijuana, and treating drug addiction as a health issue -- fight the War on Drugs with health care tools.

One of the health issues related to drug use and prison that pop out in the statistics is a growing epidemic of hepatitis-C, a potentially fatal variant of hepatitis that's mostly treatable but at substantial cost to our health care ... and prison ... system.
The explosion of incarcerating American citizens ... with nearly all of the increase attributed to drug offenses ... raises another issue but one that is inseparable from the War on Crime.
In 1980, the U.S. incarcerated 150 per 100,000 citizens in prison and, in 2012, 30 years later, the U.S. incarcerates 760 per 100,000 citizens in prison. That's a five-fold ... 500% ... increase. That's the incarceration-driven War on Drugs.
By comparison, according to Fareed Zakaria's article "Incarceration Nation" (Time Magazine, 2012-April-02), Mexico only incarcerates 208 per 100,000 ... Brazil 242 per 100,000 ... England 153 per 100,000 ... South Korea 97 per 100,000 ... France 96 per 100,000 ... Germany 90 per 100,000 ... and Japan 63 per 100,000. The United states incarcerates 3-times more citizens per 100,000 than Brazil and 5-times more than England.

In dollars, during 2009, 1.3-million Americans were arrested for drug possession. At an estimated $45,000 each, the incarceration-driven War on Drugs cost our economy an estimated $60-billion annually to incarcerate (if all were jailed).
In total, the United States now incarcerates 6-million citizens ... and, as Adam Gopnik cites in his article "The Caging of America" (The New Yorker magazine, 2012-January-30), that's more than Stalin held in the Soviet Union's Gulags!!
According to the United States Justice Department's Bureau of Prisons, drug offenses ranks first with 47% of all federal inmates there for drugs ... That's 3-times more than the second ranked of 16% there for weapons, explosives, and arson ... 4-times more than third ranked 11% imprisoned for immigration offenses ... 6% imprisoned for sex crimes and 6% for extortion, fraud, and bribery ... 4% each for robbery and for burglary, larceny, and property offenses ... and less than 1% each for any other crimes.

According to sources focused on this issue like Conscious Life News, whereas the United States federal prisons incarcerate nearly 90,000 on drug offenses, the states incarcerate an additional 240,000 Americans in prison on drug offenses. That's 330,000 Americans incarcerated for doing drugs ... and very often serving long, mandatory sentences.
And, each of those indicted and/or imprisoned on drug offenses will be marked for life as a criminal when applying for jobs. In some states, they are banned for life from voting.
AOL JOBS reports that people with a drug possession conviction have a 50% less chance of being called back after an interview or getting the job.
NPR reports: "While it's generally illegal for employers to indiscriminately deny all applicants with criminal records, many still do. A quick look at New York job postings on Craigslist, for example, reveals common caveats: "absolutely no felony convictions" or "must have clean criminal record."
So what are we waiting for? Let's decriminalize drug possession, allow for regulated sale of marijuana (like we do with liquor), release all those now incarcerated for drug possession, and expunge the criminal records of any mention of drug possession offenses.
What do you say?
by Steve Reichenstein
One of the health issues related to drug use and prison that pop out in the statistics is a growing epidemic of hepatitis-C, a potentially fatal variant of hepatitis that's mostly treatable but at substantial cost to our health care ... and prison ... system.
The explosion of incarcerating American citizens ... with nearly all of the increase attributed to drug offenses ... raises another issue but one that is inseparable from the War on Crime.
In 1980, the U.S. incarcerated 150 per 100,000 citizens in prison and, in 2012, 30 years later, the U.S. incarcerates 760 per 100,000 citizens in prison. That's a five-fold ... 500% ... increase. That's the incarceration-driven War on Drugs.
By comparison, according to Fareed Zakaria's article "Incarceration Nation" (Time Magazine, 2012-April-02), Mexico only incarcerates 208 per 100,000 ... Brazil 242 per 100,000 ... England 153 per 100,000 ... South Korea 97 per 100,000 ... France 96 per 100,000 ... Germany 90 per 100,000 ... and Japan 63 per 100,000. The United states incarcerates 3-times more citizens per 100,000 than Brazil and 5-times more than England.
In dollars, during 2009, 1.3-million Americans were arrested for drug possession. At an estimated $45,000 each, the incarceration-driven War on Drugs cost our economy an estimated $60-billion annually to incarcerate (if all were jailed).
In total, the United States now incarcerates 6-million citizens ... and, as Adam Gopnik cites in his article "The Caging of America" (The New Yorker magazine, 2012-January-30), that's more than Stalin held in the Soviet Union's Gulags!!
According to the United States Justice Department's Bureau of Prisons, drug offenses ranks first with 47% of all federal inmates there for drugs ... That's 3-times more than the second ranked of 16% there for weapons, explosives, and arson ... 4-times more than third ranked 11% imprisoned for immigration offenses ... 6% imprisoned for sex crimes and 6% for extortion, fraud, and bribery ... 4% each for robbery and for burglary, larceny, and property offenses ... and less than 1% each for any other crimes.
According to sources focused on this issue like Conscious Life News, whereas the United States federal prisons incarcerate nearly 90,000 on drug offenses, the states incarcerate an additional 240,000 Americans in prison on drug offenses. That's 330,000 Americans incarcerated for doing drugs ... and very often serving long, mandatory sentences.
And, each of those indicted and/or imprisoned on drug offenses will be marked for life as a criminal when applying for jobs. In some states, they are banned for life from voting.
AOL JOBS reports that people with a drug possession conviction have a 50% less chance of being called back after an interview or getting the job.
NPR reports: "While it's generally illegal for employers to indiscriminately deny all applicants with criminal records, many still do. A quick look at New York job postings on Craigslist, for example, reveals common caveats: "absolutely no felony convictions" or "must have clean criminal record."
So what are we waiting for? Let's decriminalize drug possession, allow for regulated sale of marijuana (like we do with liquor), release all those now incarcerated for drug possession, and expunge the criminal records of any mention of drug possession offenses.
What do you say?
by Steve Reichenstein
Wednesday, July 31, 2013
A Bell-Shaped Curve Reflects a Healthy Middle Class, We Don't Have One
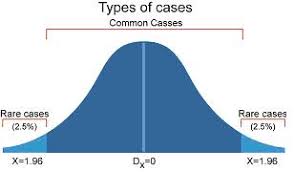
Do you remember from school the Bell-Shaped Curve?
Investopedia defines the Bell-Shaped Curve as: "The most common type of distribution for a variable. The term Bell Curve comes from the fact that the graph used to depict a normal distribution consists of a bell-shaped line. The highest point in the curve, or the top of the bell, represents the most probable event. All possible occurrences are equally distributed around the most probable event, which creates a downward-sloping line on each side of the peak."
In a democratic society with a healthy market economy, we would expect to see most of the people earning approximately the middle income. So our Bell-Shaped Curve would show that middle income is the most frequently occurring income and most incomes surround the middle. Most incomes fit under the domed part of the bell.
In an ideal Bell-Shaped Curve, shown below, the most normal income distribution expected, the closer we get to the middle income, the more people earn it: Both above and below. And, the further we get from the middle income, the fewer people earn it: So the fewest number of people are very poor or very rich.
According to the IRS, in 2010, the U.S. income distribution, presented as number of personal income tax returns by income range, of all Americans was not a Bell-Shaped Curve -- quite far from it. The chart from the IRS below shows the share of personal income tax returns by income group. It shows an income distribution skewed heavily towards the lower income groups. In 2010, extremely few earned high incomes, the largest percentage was in the middle income region, and nearly an equally large number of Americans earned low incomes. As the trend line indicates, this reflects an economy with a bulging low-income population.

The appropriate economic policies for a democratic society with a healthy market economy would be those that greatly reduce the number of people at the low income side of the curve -- moving them into the middle class "dome of the bell" -- and greatly the number of people at the high income side of the curve, so we move towards a normal income distribution and evolve the society more democratic and economy more healthy: A Bell-Shaped Curve.
Charts below from the IRS, show U.S. income distribution, based on number of income tax returns at income ranges in the 2 years prior to 2008 Wall Street Crash ... and that there was NO Bell-Shaped Curve even distribution of income. In fact, distribution of income was even worse when U.S. economy was humming along.


The Chart below compares number of IRS individual income tax returns filed in 1985, 2006, and 2007. The U.S. dollar inflation calculator estimates that $1 in 1985 would be worth nearly double in 2006 and 2007. (Inflation 1985-2006 totaled 87.4% and inflation 1985-2007 totaled 92.7%.)
This impacts the chart below by explaining the decrease in number of tax returns by those earning incomes under $10,000: Noted inflation of 87.4-92.7% would have pushed most of them into the $10,000 to < $30,000 income range. Half as many of individuals in that range would be pushed up into $30,000 to < $50,000. But the yet higher income ranges are much wider, hence less influenced by the inflation.
Therefore, this chart below shows increase in constant dollars among upper income ranges while the lower and middle remained mainly unchanged.

This final chart, below, shows U.S. median income in constant dollars (all adjusted to 1975 dollars) since the end of World War II as it actually rose and, the dotted line, as it would have risen if the median income rose at the same rate as GDP.
Notice that median income and per capita GDP rose in proportion until the late 1970's, when median income grew at a far slower, lower rate than per capita GDP rose. During the period discussed above, 1985-2007, the divergence in growth rate worsened.
All in 1975 constant dollars: Median income was approximately $50,000. It rose to approximately $60,000 by 2007, but could have risen to approximately $90,000 if median income growth had kept pace with per capita GDP growth. Median income grew by 20% during this period, but could have grown by 80% during this period.

This chart also indicates that, historically, the U.S. bell-shaped curve shift to today's non-bell-shaped curve began approximately in 1970-1980.
Also starting approximately at that time were financial deregulation, repealing or not enforcing workplace conditions rules, and significantly lowering the tax rates on the upper end of the income population.
Does a rising tide lifts all boats ... and do so proportionately at about the same percentage? Well, it depends upon having a fair playing field. Clearly, tax policy, workplace conditions rules, and financial transaction regulations seem to significantly influence which boats rise.
by Steve Reichenstein
Investopedia defines the Bell-Shaped Curve as: "The most common type of distribution for a variable. The term Bell Curve comes from the fact that the graph used to depict a normal distribution consists of a bell-shaped line. The highest point in the curve, or the top of the bell, represents the most probable event. All possible occurrences are equally distributed around the most probable event, which creates a downward-sloping line on each side of the peak."
In a democratic society with a healthy market economy, we would expect to see most of the people earning approximately the middle income. So our Bell-Shaped Curve would show that middle income is the most frequently occurring income and most incomes surround the middle. Most incomes fit under the domed part of the bell.
In an ideal Bell-Shaped Curve, shown below, the most normal income distribution expected, the closer we get to the middle income, the more people earn it: Both above and below. And, the further we get from the middle income, the fewer people earn it: So the fewest number of people are very poor or very rich.
According to the IRS, in 2010, the U.S. income distribution, presented as number of personal income tax returns by income range, of all Americans was not a Bell-Shaped Curve -- quite far from it. The chart from the IRS below shows the share of personal income tax returns by income group. It shows an income distribution skewed heavily towards the lower income groups. In 2010, extremely few earned high incomes, the largest percentage was in the middle income region, and nearly an equally large number of Americans earned low incomes. As the trend line indicates, this reflects an economy with a bulging low-income population.

The appropriate economic policies for a democratic society with a healthy market economy would be those that greatly reduce the number of people at the low income side of the curve -- moving them into the middle class "dome of the bell" -- and greatly the number of people at the high income side of the curve, so we move towards a normal income distribution and evolve the society more democratic and economy more healthy: A Bell-Shaped Curve.
Charts below from the IRS, show U.S. income distribution, based on number of income tax returns at income ranges in the 2 years prior to 2008 Wall Street Crash ... and that there was NO Bell-Shaped Curve even distribution of income. In fact, distribution of income was even worse when U.S. economy was humming along.


The Chart below compares number of IRS individual income tax returns filed in 1985, 2006, and 2007. The U.S. dollar inflation calculator estimates that $1 in 1985 would be worth nearly double in 2006 and 2007. (Inflation 1985-2006 totaled 87.4% and inflation 1985-2007 totaled 92.7%.)
This impacts the chart below by explaining the decrease in number of tax returns by those earning incomes under $10,000: Noted inflation of 87.4-92.7% would have pushed most of them into the $10,000 to < $30,000 income range. Half as many of individuals in that range would be pushed up into $30,000 to < $50,000. But the yet higher income ranges are much wider, hence less influenced by the inflation.
Therefore, this chart below shows increase in constant dollars among upper income ranges while the lower and middle remained mainly unchanged.

This final chart, below, shows U.S. median income in constant dollars (all adjusted to 1975 dollars) since the end of World War II as it actually rose and, the dotted line, as it would have risen if the median income rose at the same rate as GDP.
Notice that median income and per capita GDP rose in proportion until the late 1970's, when median income grew at a far slower, lower rate than per capita GDP rose. During the period discussed above, 1985-2007, the divergence in growth rate worsened.
All in 1975 constant dollars: Median income was approximately $50,000. It rose to approximately $60,000 by 2007, but could have risen to approximately $90,000 if median income growth had kept pace with per capita GDP growth. Median income grew by 20% during this period, but could have grown by 80% during this period.
This chart also indicates that, historically, the U.S. bell-shaped curve shift to today's non-bell-shaped curve began approximately in 1970-1980.
Also starting approximately at that time were financial deregulation, repealing or not enforcing workplace conditions rules, and significantly lowering the tax rates on the upper end of the income population.
Does a rising tide lifts all boats ... and do so proportionately at about the same percentage? Well, it depends upon having a fair playing field. Clearly, tax policy, workplace conditions rules, and financial transaction regulations seem to significantly influence which boats rise.
by Steve Reichenstein
Subscribe to:
Posts (Atom)